
Responsible AI Dashboard Model Debugging
Assessing and debugging machine learning models is critical for Responsible AI. It helps determine how and why AI systems behave the way they do. Data scientists can then use this knowledge to improve model performance. Conceptually, model debugging consists of three stages:
- Identify, to understand and recognize model errors by addressing the following questions:
- What kinds of errors does my model have?
- In what areas are errors most prevalent?
- Diagnose, to explore the reasons behind the identified errors by addressing:
- What are the causes of these errors?
- Where should I focus my resources to improve my model?
- Mitigate, to use the identification and diagnosis insights from previous stages to take targeted mitigation steps and address questions such as:
- How can I improve my model?
- What social or technical solutions exist for these issues?

Responsible AI Dashboard Decision Making
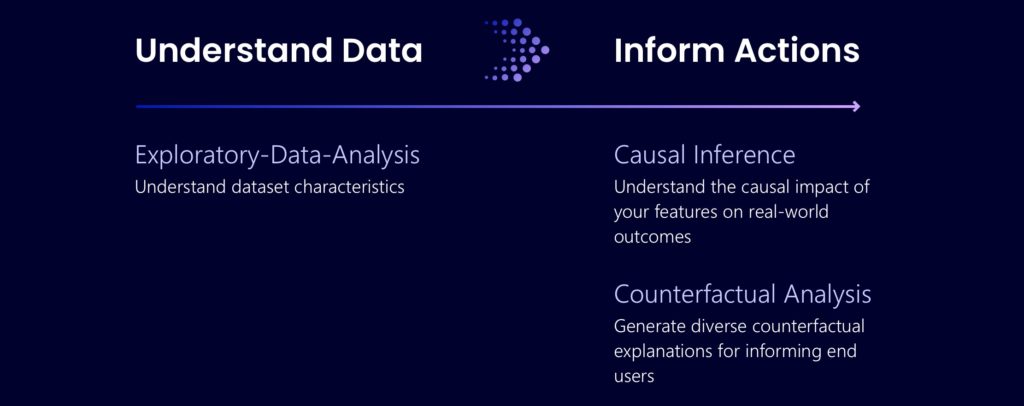
Decision-making is one of the biggest promises of machine learning. The Responsible AI dashboard helps you inform your model-driven and data-driven business decisions.
- Data-driven insights to further understand heterogeneous treatment effects on an outcome, using historic data only. For example, “how would a medicine impact a patient’s blood pressure?“.
- Model-driven insights, to answer end-users’ questions such as “what can I do to get a different outcome from your AI next time?” to inform their actions.
Responsible AI Dashboard Components
The different components of the Responsible AI Dashboard are designed such that they can easily communicate with each other. You can interactively pass cohorts and insights from one component to another for deep-dive investigations, without having to manually save and reload results in different dashboards.
Model Statistics
A high-level view of model prediction distribution is often a useful starting point when investigating its performance. Analysis along a variety of metrics can help characterize errors more specifically, such as to distinguish between false positives and negatives in binary classification. This nuance builds intuition for next steps in model debugging.
The Model Statistics dashboard component aggregates a variety of metrics for both numerical and categorical labels, and provides box plots and bar chart visualizations. The x-axis enables the display of different kinds of statistics and metrics. The y-axis enables comparative views along different cohorts and dataset features.
Use Model Statistics when you need to…
- Understand how your model performance varies across different metrics and/or subgroups in your data.
- Decide what steps to take first on your model debugging journey.
Data Explorer
Machine learning models work by making predictions based on decisions from past examples. As a result, their performance in real-world scenarios are heavily influenced by the data they are trained on. For example, when feature distribution in a dataset is skewed, this can cause a model to incorrectly predict datapoints belonging to an underrepresented group or to be optimized along an inappropriate metric.
The Data Explorer dashboard component helps to visualize datasets based on predicted and actual outcomes, error groups, and specific features. This helps to identify issues of over- and underrepresentation and to see how data is generally clustered in the dataset. Data visualizations consist of aggregate plots or individual datapoints.
Use Data Explorer when you need to …
- Understand the distribution of your dataset across different cohorts and feature groups.
- Determine whether your findings related to fairness, error analysis and causality (derived from other dashboard components) are a result of your dataset’s distribution
- Decide in which areas to collect additional data to mitigate errors arising from representation issues, label noise, feature noise, label bias, etc.
Interpretability
When ML models are used in ways that impact people’s lives, it is critically important to understand what influences the behavior of models. Interpretability helps answer questions in scenarios such as model debugging (Why did my model make this mistake? How can I improve my model?), human-AI collaboration (How can I understand and trust the model’s decisions?), and regulatory compliance (Does my model satisfy legal requirements?).
The interpretability component contributes to the “diagnose” stage of the model lifecycle workflow by generating human-understandable descriptions of the predictions of a Machine Learning model. It provides multiple views into a model’s behavior: global explanations (e.g., what features affect the overall behavior of a loan allocation model) and local explanations (e.g., why a customer’s loan application was approved or rejected). One can also observe model explanations for a selected cohort as a subgroup of data points. This is valuable when, for example, assessing fairness in model predictions for individuals in a particular demographic group. The local explanation tab of this component also represents a full data visualizations which is great for general eyeballing the data and looking at differences between correct and incorrect predictions of each cohort.
The capabilities of this component are founded by InterpretML capabilities on generating model explanations.
Use Interpretability when you need to…
- Determine how trustworthy your AI system’s predictions are by understanding what features are most important for the predictions.
- Approach the debugging of your model by understanding it first and identifying if the model is using healthy features or merely spurious correlations.
- Uncover potential sources of unfairness by understanding whether the model is predicting based on sensitive features or features highly correlated with them.
- Build end user trust in your model’s decisions by generating local explanations to illustrate their outcomes.
- Complete a regulatory audit of an AI system to validate models and monitor the impact of model decisions on humans.
Learn More
Error Analysis
One of the most apparent challenges with current model debugging practices is using aggregate metrics to score models on a benchmark. Model accuracy may not be uniform across subgroups of data, and there might exist input cohorts for which the model fails more often. The direct consequences of these failures are a lack of reliability and safety, unfairness, and a loss of trust in machine learning altogether.
The Error Analysis component provides machine learning practitioners with a deeper understanding of model failure distribution and assists them with quickly identifying erroneous cohorts of data. It contributes to the “identify” stage of the model lifecycle workflow through a decision tree that reveals cohorts with high error rates and a heatmap that visualizes how a few input features impact the error rate across cohorts. Discrepancies in error might occur when the system underperforms for specific demographic groups or infrequently observed input cohorts in the training data.The capabilities of this component are founded by Error Analysis capabilities on generating model error profiles.
Use Error Analysis when you need to…
- Gain a deep understanding of how model failures are distributed across a given dataset and across several input and feature dimensions.
- Break down the aggregate performance metrics to automatically discover erroneous cohorts and take targeted mitigation steps.
Learn More
Blog post: Responsible Machine Learning with Error Analysis (microsoft.com)
Towards Accountable AI: Hybrid Human-Machine Analyses for Characterizing System Failure. Besmira Nushi, Ece Kamar, Eric Horvitz; HCOMP 2018. PDF
Counterfactuals Analysis and What-If
What-if counterfactuals address the question of “what would the model predict if the action input is changed?, enable understanding and debugging a machine learning model in terms of how it reacts to input (feature) changes. Rather than approximating a machine learning model or ranking features by their predictive importance (which standard interpretability techniques do), counterfactual analysis “interrogates” a model to determine what changes to a particular datapoint would flip the model decision. Such an analysis helps in disentangling the impact of different correlated features in isolation or for acquiring a more nuanced understanding on how much of a feature change is needed to see a model decision flip.
The Counterfactual Analysis and what-if component consists of two functionalities:
- Generating a set of examples with minimal changes to a given point such that they change the model’s prediction (i.e. showing the closest datapoints with opposite model precisions)
- Enabling users to generate their own what-if perturbations to understand how the model reacts to features’ changes.
The capabilities of this component are founded by DiCE package, which implements counterfactual explanations that provide this information by showing feature-perturbed versions of the same datapoint who would have received a different model prediction (e.g., Taylor would have received the loan if his/her income was higher by $10,000).
Use What-If Counterfactuals when you need to:
- Examine fairness and reliability criteria as a decision evaluator.
- Debug specific input instances in depth.
- Provide solutions to end users and determining what they can do to get a desirable outcome from the model next time.
Learn More
- DiCE Documentation -> interpretml/DiCE: Generate Diverse Counterfactual Explanations for any machine learning model. (github.com)
- Research Project -> DiCE: Diverse Counterfactual Explanations for Machine Learning Classifiers – Microsoft Research
- Research Paper -> [1905.07697] Explaining Machine Learning Classifiers through Diverse Counterfactual Explanations (arxiv.org)
Causal Inference
While machine learning models are particularly powerful in identifying patterns in data and making predictions, they offer little support for estimating how a real-world outcome changes in the presence of an intervention. Practitioners have become increasingly focused on using historic data to inform their future decisions and business interventions e.g., how would revenue be affected if a corporation pursues a new pricing strategy? Would a new medication improve a patient’s condition, all else equal?
The Causal Inference component addresses these questions by estimating the effect of a feature on an outcome of interest on average, across a population or a cohort and on an individual level. It also helps to construct promising interventions by simulating different feature responses to various interventions and creating rules to determine which population cohorts would benefit from a particular intervention. Collectively, these functionalities allow decision makers to apply new policies and effect real-world change.
The capabilities of this component are founded by EconML package, which estimates heterogeneous treatment effects from observational data via machine learning.
Use Causal Inference when you need to…
- Identify the features that have the most direct effect on your outcome of interest
- Decide what overall treatment policy to take to maximize real-world impact on an outcome of interest
- Understand how individuals with certain feature values would respond to a particular treatment policy
Learn More
- Blog post: Be Careful When Interpreting Predictive Models in Search of Causal Insights
- EconML: https://www.microsoft.com/en-us/research/project/econml/
- EconML Documentation: https://econml.azurewebsites.net/